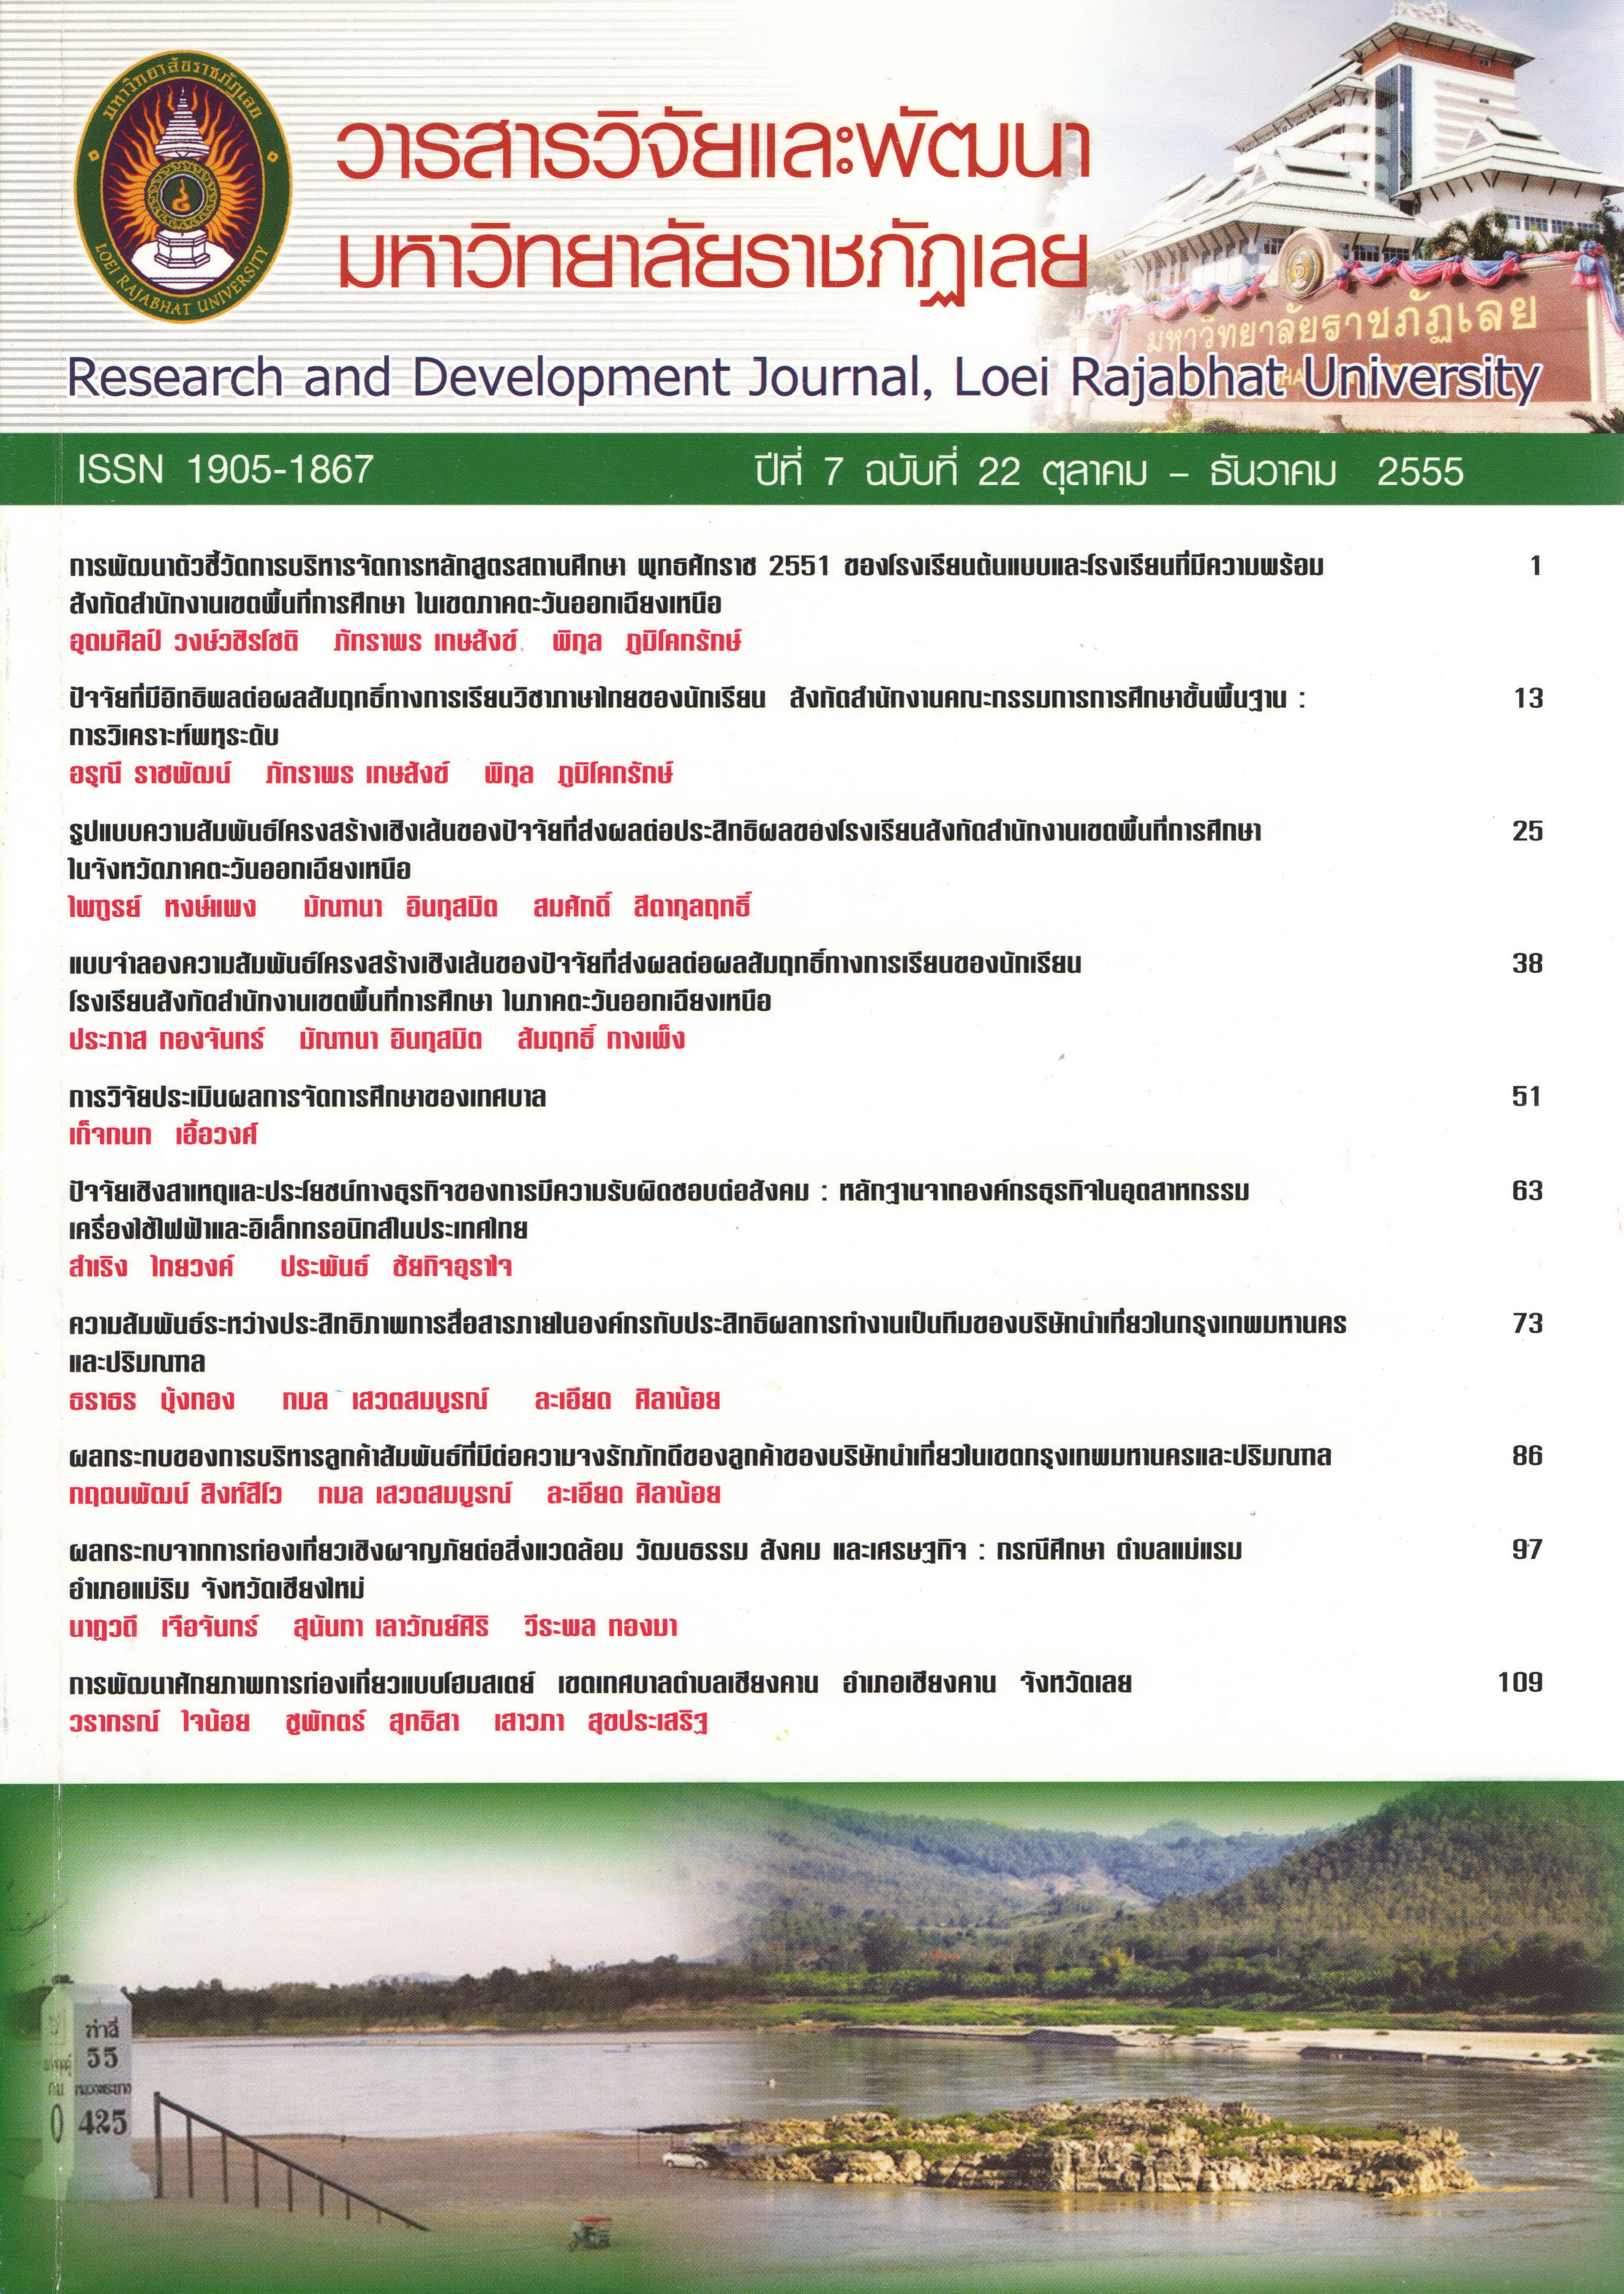
การพัฒนาตัวชี้วัดการบริหารจัดการหลักสูตรสถานศึกษา พุทธศักราช 2551 ของโรงเรียนต้นแบบและโรงเรียนที่มีความพร้อม สังกัดสำนักงานเขตพื้นที่การศึกษา ในเขตภาคตะวันออกเฉียงเหนือ
คำสำคัญ:
ตัวชี้วัด, หลักสูตรสถานศึกษา, indicators, curriculumบทคัดย่อ
บทคัดย่อ
งานวิจัยครั้งนี้ มีวัตถุประสงค์เพื่อสร้างตัวชี้วัดการบริหารจัดการหลักสูตรสถานศึกษา พุทธศักราช 2551 และเพื่อทดสอบความสอดคล้องของตัวชี้วัดการบริหารจัดการหลักสูตรสถานศึกษา พุทธศักราช 2551 กับข้อมูลเชิงประจักษ์ ขั้นตอนในการดำเนินการวิจัยมี 3 ระยะ คือ 3 ระยะ ที่ 1 การจัดทำตัวชี้วัดเชิงทฤษฎีของการบริหารจัดการหลักสูตรสถานศึกษา พุทธศักราช 2551 ใช้การศึกษาแนวคิดทฤษฎีที่เกี่ยวกับหลักการและองค์ประกอบของการบริหารจัดการหลักสูตร จากเอกสาร หลักฐาน หนังสือ บทความ และงานวิจัยที่เกี่ยวข้อง และคำสัมภาษณ์จากผู้เชี่ยวชาญมาวิเคราะห์ รวบรวมเป็นตัวชี้วัดตัวประกอบของการบริหารจัดการหลักสูตร โดยใช้โปรแกรมสำเร็จรูป NVivo 8 ระยะที่ 2 การหาคุณภาพตัวชี้วัดการบริหารจัดการหลักสูตร สถานศึกษา พุทธศักราช 2551 ของโรงเรียน ต้นแบบและโรงเรียนที่มีความพร้อม และระยะที่ 3 การทดสอบความสอดคล้องของตัวชี้วัดประสิทธิภาพการบริหารจัดการหลักสูตรสถานศึกษา พุทธศักราช 2551 กับข้อมูลเชิงประจักษ์ ค่าความเชื่อมั่น พบว่า ด้านการจัดทำหลักสูตรสถานศึกษา พุทธศักราช 2551 มีค่าเท่ากับ 0.837 ด้านการดำเนินการระดับชั้นเรียน มีค่าเท่ากับ 0.915 ด้านการส่งเสริมสนับสนุนระดับสถานศึกษา มีค่าเท่ากับ 0.879 ด้านการกำกับดูแลระดับสถานศึกษา มีค่าเท่ากับ 0.886 และดำเนินการเก็บรวบรวมข้อมูลกับกลุ่มตัวอย่าง โดยการสุ่มแบบแบ่งชั้น ที่ครอบคลุมประเภทของสถานศึกษา ได้กลุ่มตัวอย่าง จำนวน 210 คน ผลการวิจัยสรุปได้ ดังนี้
1. ผลจากการร่างและพัฒนาตัวชี้วัด ปรากฏว่าได้ตัวชี้วัด จำนวน 39 ตัว ภายใต้กรอบตัวประกอบของการบริหารจัดการหลักสูตรสถานศึกษา พุทธศักราช 2551 จำนวน 4 ตัวประกอบ ดังนี้ ด้านการจัดทำหลักสูตรสถานศึกษา พุทธศักราช 2551 มีจำนวน 10 ตัวชี้วัด ด้านการดำเนินการระดับชั้นเรียน มีจำนวน 9 ตัวชี้วัด ด้านการส่งเสริมสนับสนุนระดับสถานศึกษา มีจำนวน 10 ตัวชี้วัด ด้านการกำกับดูแลระดับสถานศึกษา จำนวน 10 ตัวชี้วัด ค่าน้ำหนักตัวประกอบทั้ง 4 ตัว มีค่าเป็นบวก มีค่าตั้งแต่ .39 ถึง .67 สามารถอธิบายความแปรปรวนของการบริหารจัดการหลักสูตรสถานศึกษาหรือสัมประสิทธิ์การพยากรณ์ ได้ร้อยละ 39 ถึง 89 ตัวประกอบที่อธิบายความแปรปรวนของการบริหารจัดการหลักสูตรสถานศึกษาได้สูงที่สุด คือ ด้านการกำกับดูแลคุณภาพระดับสถานศึกษา
2. ผลการตรวจสอบความสอดคล้องของการวิเคราะห์ตัวประกอบเชิงยืนยันของตัวชี้วัด พิจารณาจากค่าสถิติ ดังนี้ c2 = 610.88, ค่า df = 595 p-Value = 1.027 ค่า GFI = 0.97 ค่า RMSEA = 0.011 และค่า CN = 209.63
Abstract
This research aimed to construct indicators of B.E.2008 school curriculum management and to test the goodness of fit of indicators with the empirical data. The research was divided into two phases. The first phase was the indicators construction based on the theory of school curriculum management. This phase was documentary study including reviewing the related literatures. The interview from the experts and analyzed the data for being indicators of the school curriculum management which NVivo 8 was applied in this phase. The second phase was to find out the quality of the indicators of B.E. 2008 school curriculum management in the prototype schools and the readiness and the third phase was to test the goodness of fit indicators with the empirical data. The reliability found that the curriculum construction was 0.837, the performance at the classroom level was 0.915, the promotion at the school level was 0.879 and 0.886 for the supervision at the school level. The stratified random sampling was applied for 210 samples.
The findings were summarized as follows :
1. The results of the indicator formation and development found 39 indicators under of curriculum management framing. There were 4 factors with 39 indicators : 10 indicators for curriculum construction, 9 indicators for the performance at the classroom level, 10 indicators for the promotion at the school level and the supervision at the school level had 10 indicators. The weight of 4 factors was positive from .39-.67 thus it could describe the variance of curriculum management or the predictive efficiency was 39- 89 percent. The highest factor described the variance of the efficiency was the supervision at the school level.
2. The goodness of fit test of the indicators’ confirmatory factor analysis model found the models which developed were fit to the empirical data following the hypotheses and based on the statistics as follows : c2 = 610.88, df = 595, p-value = .512, c2/df = .99, GFI = 0.97, RMSEA = 0.01 and Critical N = 209.63
ดาวน์โหลด
รูปแบบการอ้างอิง
ฉบับ
ประเภทบทความ
สัญญาอนุญาต
ข้อความที่ปรากฎในวารสารฉบับนี้เป็นความคิดเห็นของผู้เขียนแต่ละท่าน สถาบันวิจัยและพัฒนา มหาวิทยาลัยราชภัฏเลย และกองบรรณาธิการ ไม่จำเป็นต้องเห็นด้วยและไม่มีส่วนรับผิดชอบใดๆ
สถาบันวิจัยและพัฒนา มหาวิทยาลัยราชภัฏเลย ขอให้ผู้อ่านอ้างอิงในกรณีที่ท่านคัดลอกเนื้อหาบทความในวารสารฉบับนี้


